Climate FieldView takes data analysis up a level

Posted 4 years ago
21/02/2022

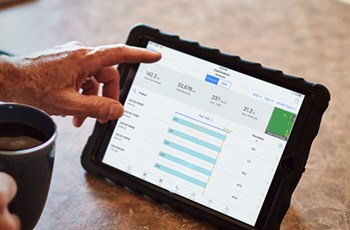
Bayer's FieldView is a global platform for the collating and analysing of field data to support more informed crop management. From soil texture scans to crop protection and fertiliser applications to yield data, the maps can be viewed side-by-side or viewed separately depending on the user’s requirement.
“The value to the user is that the data is in one place where it can be easily analysed to identify the impact of previous decisions – this is likely to be of interest to those using variable rate practices – and support data driven decision making for better performance,” Edward Lawton-Bradshaw, Bayer Climate Activation Specialist, says.
“The user can import boundary data from other crop management software, and this enables satellite images for your farm going back to 2017 to be viewed. This can be particularly useful when looking at new parcels of land where the cropping history and performance is not known,” he adds.
FieldView is integrated with CLAAS and John Deere systems and synchronised with Gatekeeper to ensure accurate records, remove duplication, and satisfy farm assurance requirements. The user creates an account online (with support available) before installing the necessary applications on an iPad.
To capture data from machinery with the FieldView drive, an iPad is required (currently) but data can be viewed on either Android or Apple iOS. Data can be shared with partners at the account holder’s discretion and images can be filtered by crop or variety and ranked by field.
The user can also toggle between NDVI vegetation (biomass) images which are better suited to analysing crop emergence and canopy development, and scouting images which are popular for prioritising crop walking or identifying problem areas in a field.
“The algorithm behind the scouting image differs slightly from that used to display biomass by being biased towards highlighting the variation within the field to make it easier to identify areas in need of greater management attention,” Mr Lawton-Bradshaw says.
“Different forms of image can be produced depending on the purpose. Water-use maps, which show crop transpiration in millilitres per day, are valuable for irrigated crops as the variation in uptake can be easily compared. This helps as much with irrigation scheduling as it does with application rates.”
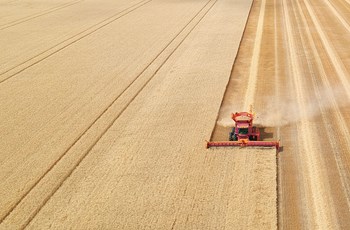
Biomass images can be filtered in a similar way to identify crops in need of closer monitoring and plan seasonal workloads, for instance spraying. Decreasing biomass rates can also show rate of crop senescence pre-harvest.
Yield maps are perhaps most valuable for identifying areas of contrasting performance for later investigation. The potential of yield maps is still to be fully harnessed but as accuracy improves and the types of analysis that can be performed is extended, their value to the user will increase.
“It is possible to scrutinise performance within a field. By drawing a polygon around the desired area, the yield and other data such as moisture content can be displayed. This has value for assessing on-farm trials such as changes to seed spacing, bed or row width, fertiliser rates or between varieties, but there is still more to come,” Mr Lawton-Bradshaw says.
FieldView was introduced to the UK in May 2020. Bayer continues to gather feedback from pilot users as to how it can be developed further ahead of its commercial release. If you are a grower interested in supporting its development, please visit www.climatefieldview.co.uk for details or contact Edward Lawton-Bradshaw at edward.lawton-bradshaw@bayer.com or call him on 07442 939 171.
|
|
John Weir, Gateside, Fife. 65 hectares of mainly pre-pack whites and Maris Piper
We’ve been using FieldView for about a year and I am yet to fully get to grips with all of its features. What I like about it so far is the excellent accessibility. It is available all the time and the images are updated regularly with an email notifying me that there are new maps to view.
From these I can investigate crop development and compare it with yield maps from previous years to understand differences in crop growth and identify areas in need of closer inspection. It means you arrive at the field with a clear indication of which parts of the crop need to be inspected. Our crop walking is better targeted as a result.
I’ve been using it to look at the potato enterprise in a range of different ways and so far, I have not uncovered any irregularities. As we strive to be more efficient with the use of inputs such as water and fertiliser, the scope for failing to meet crop needs increases so we must be aware of the need to monitor crop development regularly and promptly respond to any issues
My principal interest in FieldView is in investigating the potential of variable seed spacing. I am largely at the data gathering stage, but I will use FieldView to monitor crops and overlay my planting prescription to see what relationships there are and whether I am happy with the decisions I made.
I will then further analyse the crop again pre-harvest when I will perform crop digs at pre-determined locations. The information will then be overlayed with vegetation maps to extrapolate a yield forecast. This can then be compared with the actual yield at harvest.