Find out more about the technologies used, challenges and breakthroughs in digital crop imaging for farming.
Author
| 23rd February 2021Understanding crop imaging in digital farming
Dr Richard Green, Head of Engineering Research at the National Centre of Precision Farming at Harper Adams University, is an expert in digital crop imaging and explores these questions further.
What technologies collect digital crop images for farming?
Images can be collected by various technologies, including:
Satellites
Aircraft
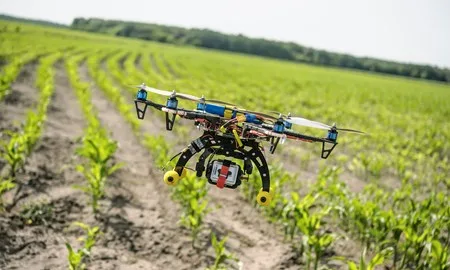
Drones
Cameras mounted on machinery
Smartphones
The challenge of image resolution
Image resolution is often a challenge across these different technologies. Broadly speaking, the higher the camera is mounted, the lower the resolution.
Satellite imagery is improving in its resolution. For example, European Space Imaging utilises the WorldView Constellation to acquire imagery at 30-50 cm resolution. However, that’s still nowhere near the detail that can be obtained by high resolution cameras mounted on machinery, which typically have pixel sizes of 1mm2 or better.
Some crops and tasks require much higher image resolution than others, and lower resolution imagery is not necessarily a problem, especially if it is more cost-effective.
For example, farmers spreading nitrogen at 24 m-plus are unlikely to need the level of detail provided by 1 mm resolution images, whereas another grower of high value crops may do so in order to identify individual plants. Imagery must be appropriate to the crop and task it is required for.
What types of digital crop images can be collected?
Alongside images visible to the naked eye, digital sensors can collect light wavelengths invisible to us. That extends from ultraviolet, through visible, to infrared and longer wavelengths such as radar. “All can be used on each platform,” says Dr Green.
The most common for agriculture are the visual range, red, green and blue, plus red edge, and near infrared (NIR) images.
There are three methods of collecting multispectral light images, where different wavelengths are collected with one camera
Two use single lens cameras, and split the light into different wavelengths using custom filters onto a single sensor, or prisms to send it to separate sensors for each colour plane
The third cheaper alternative is a multispectral camera, which is made up of different cameras each with an individual lens and filter collecting a different wavelength.
The latter is fine for drone imaging, but is unsuitable for close-up work due to the parallax errors that occur when combining images taken through lenses with different viewpoints. This makes it impossible to perform arithmetic pixel-by-pixel image processing, as the different cameras’ pixels don’t perfectly map on top of one another.
How are the digital crop images processed?
Each picture usually only covers a small area of the field, so if you want to look at the entire field, you need to overlay the pictures in a process called mosaicking.
“Usually, you have between 60-80% overlap on each picture, and then smart software joins the pictures together. It helps put GPS-located markers in the field, to determine geospatial alignment enabling the image to be overlaid on a map.”
Dr Richard Green
Once you have the image, you can run algorithms to help highlight differences. The most popular is normalised difference vegetation index (NDVI), which provides a reflectance level or number for each pixel, which can be converted into a colour heat map for visualisation.
Healthy plants have a lot of chlorophyll, which absorbs visible light, but reflects near-infrared light, so this helps highlight where you have lots of healthy plants. This information can be used at all levels from satellite images looking for broad acres of healthy crops to field level differences in crop health caused by water stress, pests or disease.
What about thermal digital crop imaging?
Thermal imaging captures an image using long-infrared wavelengths. It shows how hot the crop is and is useful to identify water stress. Healthy crops with plenty of water tend to be slightly cooler.
How else can digital crop images be used?
Another tool which can be used to help process images and identify patterns is artificial intelligence, Dr Green says. An interesting use of AI is to identify weeds. The system needs training, so you have to start with a large number of pictures. However, you take a picture, upload it, and the tool identifies the weed.
Can you predict disease outbreaks through digital crop imaging?
The potential to predict disease outbreaks before symptoms are seen is being researched using advanced, hyperspectral cameras which look at up to 128 different light frequencies mostly in the infrared spectrum. Theoretically, a disease or pest might absorb or reflect a particular frequency or frequencies, creating a specific fingerprint that can be spotted by a camera designed for that issue, Dr Green explains.
Does cloud cover affect digital crop imaging?
Cloud cover is a barrier for most types of satellite images, and as a business model using commercial planes to take images has so far not stacked up.
However, synthetic aperture radar (SAR) can penetrate clouds and work at night, which makes it particularly interesting. It uses radio waves to create the image, but is complicated to process.
Potential uses include crop type mapping and estimates of crop condition, soil moisture and crop yield, although currently it is more applicable to large-scale monitoring.
Another type of radar, ground penetrating radar, is used to look for soil compaction, or crop development underground.
Are there other digital crop imaging alternatives?
Another method of creating a digital image is laser-based LiDAR (Light Detection and Ranging). Pulsed light waves are sent into the environment, with the time taken for each pulse to return used to calculate the distance it has travelled.
This is repeated many times a second to create a real-time, precise 3D point-cloud map. It could be used to judge grass height in a sward, and whether it is time to graze or cut.
Another use is on autonomous vehicles. To get a 3D map generates an incredible amount of data, so you need massive amounts of processing power, which has until recently held back its use for driverless vehicles.
The future of digital crop imaging
With many commercial systems in development, costs are falling, Dr Green points out. “Each of these provides a single data source. The Holy Grail is to use sensor fusion to combine these with data from lots of other sources, which, after processing, will provide farmers useful advice for their businesses. There is a lot of potential, but systems need to be as seamless as possible.”
***
This blog post is based on an article from the spring 2021 issue of Crop Focus magazine. The magazine is packed full of insight, advice and research from the world of arable farming to help you grow the most profitable crops possible. Over 90% of readers find Crop Focus an interesting read – it’s free to subscribe so sign-up today!