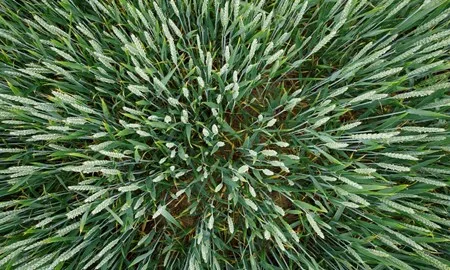
Maxmising yield is key to reducing cost per tonne and there are several physical crop performance measures that can help drive improvements.
Author
| 8th November 2018Tags
How to measure crop performance through key performance indicators
Maximising yield is key to reducing cost per tonne and there are several physical crop performance measures that can help drive improvements.
Many of the benchmarks for a “good” crop are described in the respective AHDB Growth Guides for wheat, barley and oilseed rape - https://cereals.ahdb.org.uk/crop-management/general-guides.aspx.
However Yield Enhancement Network (YEN) research suggests some re-tuning of growth guide benchmarks is required for the highest-yielding crops. The wheat guide for example, is based on an 11 t/ha crop, while the oilseed rape guide targets a 5 t/ha crop.YEN team leader Roger Sylvester-Bradley of ADAS outlines some of the main physical performance indicators for wheat:
Wheat
Established plant population
Plant density greatly affects crop structure - low populations limit yield if crops don’t compensate through increased tillering, root growth or canopy production
Work back from the target yield and heads/m2 to calculate plant population required – take your expectations for tillering capacity into account
Be realistic about likely establishment %, tillering capacity and tiller survival when determining optimum sowing rate for individual varieties
Plant population is hard to measure beyond the three-leaf stage - focus on shoot counts thereafter.
Shoot numbers
Once tillering begins, shoot numbers are a better indicator of yield potential than plant population
Crops with more surviving tillers generally produce more heads and a higher grain yield
Optimum tiller number depends on yield potential of the variety and site - work back from target yield and ear number to see how many tillers are required to achieve this.
Ground cover
High biomass crops have more green leaf area to maximise light interception and build yield, but too much biomass comes at a cost
Measure ground cover using the Green Area Index (GAI) - the ratio of total green area ( to the ground area
Aim for GAI of at least 2 by growth stage 31 (first node detectable)
GAI 6-7 at flowering is the optimum canopy size for grain production (maximum GAI typically occurs between flag leaf emergence and ear emergence)
Extending the period of full green ground cover either side of the normal peak – so earlier in spring (March/April) and later in summer (July/August) – is key to increasing yield.
Ear numbers after flowering
Ear number per m2 has the greatest link to final yield
Crops can compensate slightly for low ear number by increasing grain size or number per ear, but the impact is not as great as ear density
An 11t/ha crop typically has 500 ears/m2, however YEN research shows 15 t/ha crops need nearer 600-700 ears/m2
Crop management must be tailored to yield potential.
Oilseed rape
Performance indicators based on AHDB Growth Guide recommendations include:
Plant population
Establishing the optimum plant stand and canopy structure is crucial to maximise light interception and seed yield - thick canopies are at greater lodging risk and are likely to reflect more light during flowering
Research suggests in ideal situations 25-35 plants/m2 is optimal for highest yield in hybrid and conventional varieties
Be realistic about likely establishment when selecting the seed rate to achieve this
Ground cover
Manage crops to achieve a target GAI of 3.5 at flowering for optimal canopy structure, light interception and yield
Each GAI unit contains around 50kg N/ha. Use this information to optimise top dressing.
Pod/seed number
Seed number is critical to final yield and is largely determined in a 19-25 day period after mid-flowering
A 5 t/ha oilseed rape crop has around 100,000 seeds/m2
The optimum pod number for high seed yield is around 6,000-8,000 pods/m2
Crops with excessive pods (10,000/m2) may yield less due to poor light interception.