How to use Climate FieldView to map black-grass and create a variable rate seeding map

Posted 6 years ago
19/08/2020

Using Climate FieldView has helped a grower map areas of black-grass within a field, and combine that map with soil type differences to create a variable seed rate map for a spring barley crop, all within days of signing up.
The Wiltshire grower was onboarded by Climate Field Product Specialist Max Dafforn at the end of March, and within a week was using information from the platform to drill a spring barley crop with variable seed rates to help combat patches of black-grass and different soil types within the field.
“As I was setting him up with FieldView, the farmer was describing this field due to go into spring barley with very variable populations of black-grass,” Mr Dafforn explains.
“This was perfect to illustrate how FieldView can very simply map areas using its satellite imagery, and then use these to design a variable rate seeding map.”
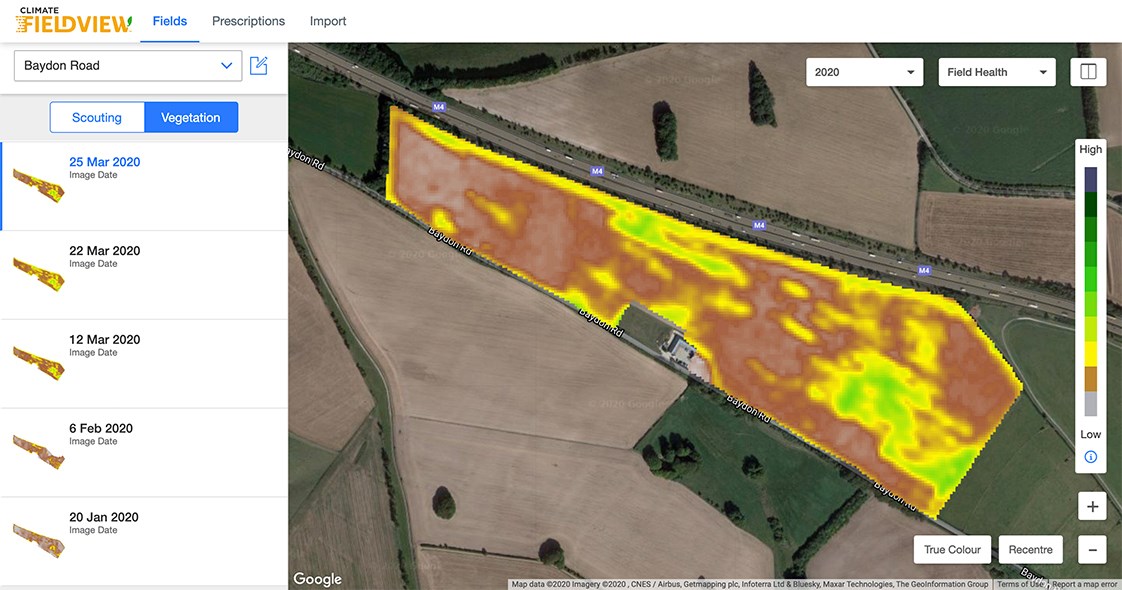
Step one was importing his field boundaries into the system. Once complete, satellite imagery will automatically begin to download for each field. “This happened while we were still chatting on the phone.”
FieldView provides users with up to date satellite imagery as well as backdated images since 2017. Images can be viewed using four different views – true colour, vegetation, scouting and water use maps.
True colour is similar to Google Earth, the vegetation image is like an NDVI image, but uses the unique Climate Crop Imaging algorithm, which helps distinguish differences in biomass more effectively later in the season when canopies close over. The scouting map uses that image, but translates it to a more visual image using colour differentials to highlight differences in the field.
In this case, it was clear the vegetation image was mapping the areas of the field with black-grass in the field, he says.
To check the robustness of the data, Mr Dafforn also visited the field to ground truth the image. “The app is really intuitive to use in the field and you don’t really need any guidance.
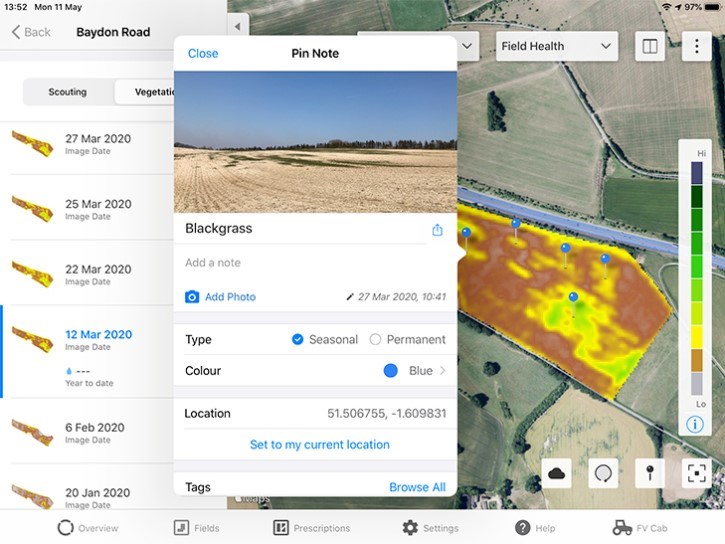
“It’s easy to drop pins based on where you are stood in the field using the iPhone or iPad’s GPS, so I walked the field and dropped pins in each of the areas of black-grass, and took photos which can viewed by anyone the farmer has given access to the account.”
The ground truthing matched the satellite imagery down to small patches of black-grass, Mr Dafforn says.
Based on the data he was then able to break the field into three different zones of black-grass pressure: low, medium and high.
On top of that he uploaded soil zoning data from Rhiza into the platform, as the field’s soil type varies from heavy clay to lighter chalky soils.
Using both he was able to create a variable seed rate map which took account of higher seed rates needed for areas of likely higher black-grass pressure and / or where the soil type was heavier, and therefore likely to have less good seedbed conditions.
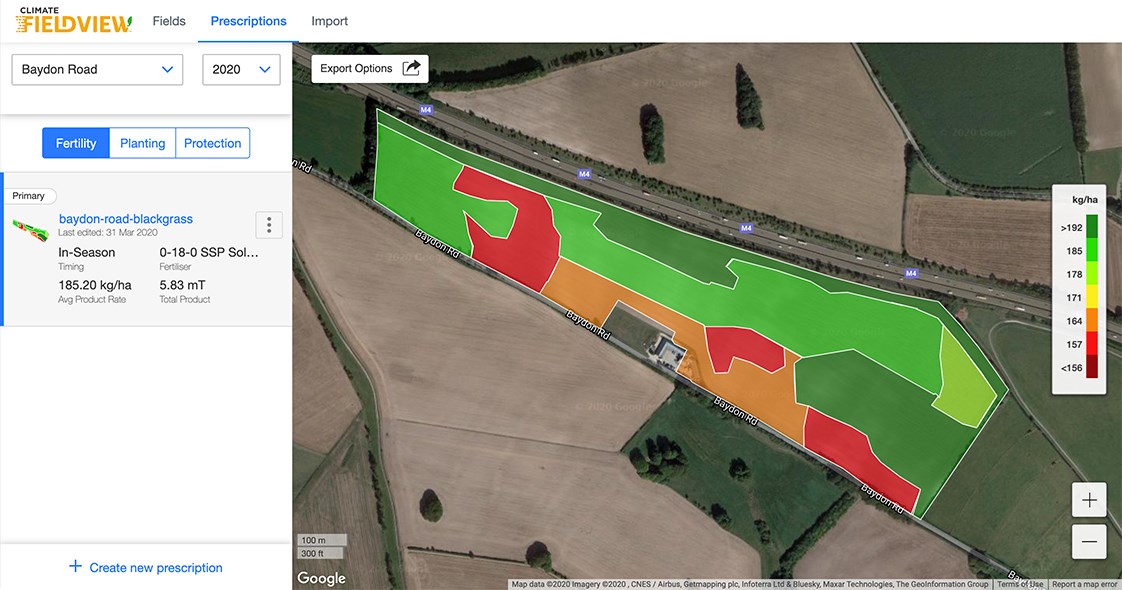
“The farmer’s usual seed rate would have been 180 kg/ha, but he told me he was happy to vary between 160 and 200 kg/ha. Overall it increased the amount of seed he used by about 200kg, but it would have been easy to adjust down if he didn’t have extra seed available.”
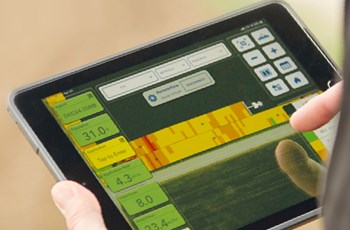
The map was then simply exported as a prescription file onto a USB stick, which could then be uploaded into the grower’s TopCon X30 touchscreen system to variably control the drill.
“Within a week of setting up the account, the imagery had been used to identify a problem, scouted and mapped it, and then come up with a plan within FieldView of what to do to tackle it, so it was almost instant setup and application.”