6 key performance measures in arable crops

Posted 8 years ago
08/11/2018
Measuring financial and physical performance helps to benchmark costs and business performance.
But with so many different elements to consider, what are most appropriate measures for arable farms?
Strutt & Parker recommends starting with six simple performance indicators, summarised in the table and chart below. They are all quick, straightforward calculations that do not require detailed financial accounts, but still provide a useful indicator of how key costs and operational capacity compare, says the firm’s George Badger.
This can highlight potential areas for savings and show where more detailed financial analysis and benchmarking comparisons may be worthwhile.
| Measurement | What it shows |
| 1. Cropped hectares per Arable Labour Unit (one ALU = 2,200 hours worked/year) |
|
| 2. Litres of red diesel used per cropped hectare |
|
| 3. Horsepower per cropped hectare (total hp of all tractors, telehandlers and self-propelled sprayers - excludes combine/forage harvester(s)) |
|
| 4. Drilled hectares per metre of drill width (excludes cultivators with seeder units) |
|
| 5. Cropped hectares per metre of sprayer boom |
|
| 6. Combined hectares per metre of combine cutter bar |
The charts below show aggregated results produced by Strutt & Parker from more than 145 farms, ranging from 100ha to 2500ha.
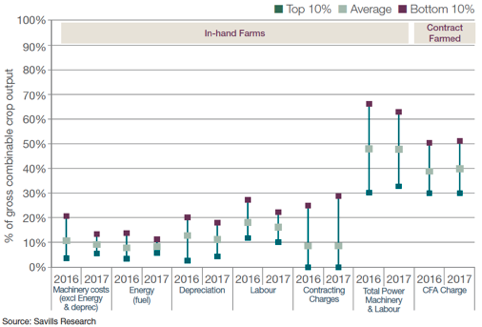
Source: Strutt & Parker
Labour and machinery represent the largest costs on many farms, so are often the focus for benchmarking.
Mr Badger recommends calculating total labour costs (including all full/part-time staff, benefits, accommodation, pensions, NI contributions, etc.) and total machinery costs (depreciation, repairs, fuel, insurance, interest, hire charges etc.) on a per hectare basis.
After this, you can go into more detail to examine the costs of operating individual machines and calculate a running cost per hour. This in turn, can be used to work out the total operational cost for growing a specific crop.
For example, S&P analysis put the average operational cost for winter wheat close to £300/ha, although this ranges widely from £200 to £400/ha.
“You can convert this figure to a per tonne basis, but given yield varies so much, we’ve found it more useful to compare farms on an area basis.”